Sprague Regulatory Matters is provided as a courtesy to our customers. Please note that the information contained in Sprague Regulatory Matters is for informational purposes only and should not be construed as legal or business advice on any subject matter. You should not act or refrain from acting on the basis of any information included in this without seeking legal or professional advice.
Natural Gas Pipeline Capacity Grew
National – Natural Gas
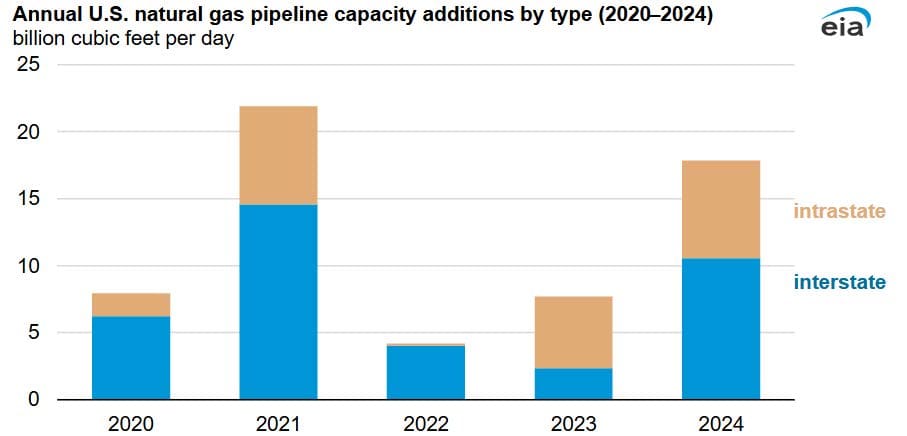
U.S. natural gas pipeline projects completed in 2024 increased takeaway capacity by approximately 6.5 billion cubic feet per day (Bcf/d) last year in the natural gas producing regions of Appalachia, Haynesville, Permian, and Eagle Ford (Natural gas pipeline project completions increase takeaway capacity in producing regions – U.S. Energy Information Administration (EIA)). These pipelines deliver natural gas from the producing regions to consumption centers in the Northeast and mid-Atlantic with two major projects increasing takeaway capacity in this particular region just under 3 Bcf/d: The Mountain Valley Pipeline provides for up to 2.0 Bcf/d of Appalachian Basin production from Wetzel, West Virginia; and the Regional Energy Access project is an expansion of existing infrastructure between Luzerne County, Pennsylvania, and Middlesex County, New Jersey allowing for an additional 0.8 Bcf/d. The interstate project capacity additions outpaced intrastate additions, and total pipeline capacity additions surpassed the previous year’s additions for the second year in a row.

Increasing Electric Competition
South Carolina – Electric
If legislative efforts pass in the South Carolina General Assembly, a watchdog organization asserts that a new bill to be introduced would help increase competition across the state’s energy sector. The Palmetto Industrial Energy Association (Palmetto Industrial Energy Association) as well as State Senators Climer and Fernandez are advocating for limited retail choice for industrial consumers in follow up to a consultant report (Advocates push for retail choice among SC’s energy providers – ABC Columbia).
Annual Report on Electric Competition
Michigan – Electric
The Michigan Public Service Commission issued its annual report on electric competition (2024 Status of Electric Competition in Michigan). Michigan legislation restricts that no more than ten percent of an electric utility’s average weather-adjusted sales for the preceding calendar year may take service from an alternative supplier. While participation by residential customers continues to be non-existent, some highlights include the following: (1) There were approximately 5,500 customers participating in the electric choice programs, down slightly from the prior year, and this represents approximately 2,200 megawatts of electric demand, which is a significant decrease from 2023. (2) As of December 2024, an additional 5,900 customers remained in a queue to take service from an alternative supplier. (3) The electric choice participation remained around ten percent for each utility. (4) Every Michigan licensed supplier is now subject to capacity demonstration and state reliability mechanism provisions requiring that they have enough resources to serve customers four years forward and if they do not, they are subject to a Commission-approved capacity charge. (5) There are 21 licensed alternative suppliers with seven actively serving customers in the state.
Natural Gas Spot Prices Forecasted to Increase in 2025 & 2026
National – Natural Gas
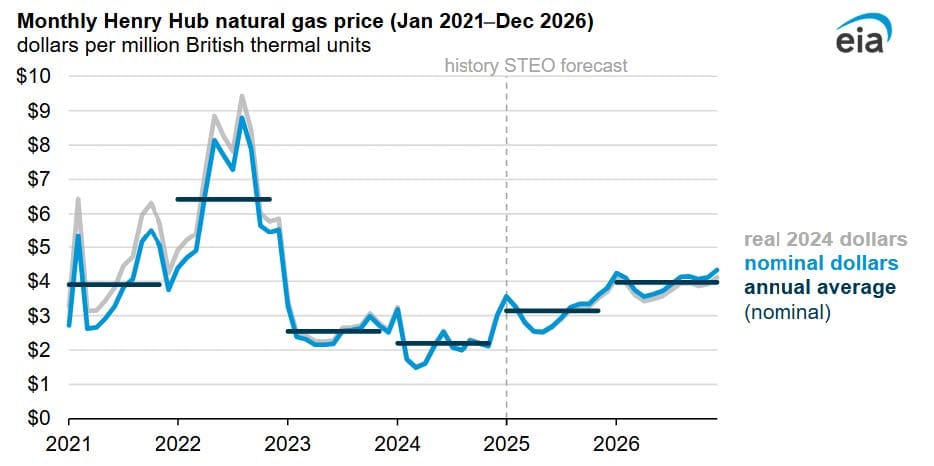
The U.S. Energy Information Administration (EIA) expects increases in the Henry Hub natural gas price in 2025 and 2026 as demand for natural gas grows faster than supply, driven mainly by higher demand for U.S. liquified natural gas (LNG) (EIA expects higher wholesale U.S. natural gas prices as demand increases – U.S. Energy Information Administration (EIA)). EIA forecasts the U.S. benchmark Henry Hub natural gas spot price to increase in 2025 to average $3.10/MMBtu and in 2026 to average $4.00/MMBtu from the record low set in 2024.

Expanding Retail Choice to Residential Customers
Virginia – Electric
Legislation has been introduced in Virginia, Senate Bill 1281 (VA SB1281 | 2025 | Regular Session | LegiScan), that if ultimately enacted would allow a residential customer using 1,000 kilowatt hours per month whose bill exceeded 125 percent of the statewide average during the most recent calendar year to purchase electricity from any supplier of electric energy licensed to sell retail electric energy within the Commonwealth of Virginia.
Federal Energy Regulatory Commission Leadership
National – Electric & Natural Gas
President Donald Trump named Mark Christie Chairman of the Federal Energy Regulatory Commission (FERC) (President Trump Names Mark Christie Chairman of FERC | Federal Energy Regulatory Commission). Chairman Christie began his term as a FERC Commissioner in January 2021, after having been nominated by President Trump in July 2020 and confirmed by the U.S. Senate in November 2020. Prior to joining the FERC, Christie was the Chairman of the Virginia State Corporation Commission, on which he served for nearly 17 years. He was elected to the Virginia State Corporation Commission, which regulates utilities, insurance and banking, three times by the Virginia legislature on bipartisan votes.
Annual Report on the State of Electric Competition
Connecticut – Electric
The Connecticut Public Utilities Regulatory Authority drafted for the Legislature its Annual Report on the State of Electric Competition (24-11-01 Proposed Legislative Report.pdf). The report includes various details and statistics on customer complaints, residential and business standard offer service rates, and the number of suppliers and aggregators operating within the state. In 2024, Connecticut had 32 suppliers and aggregators serving approximately 330,000 customers (20 percent of all electric distribution company customers) and accounted for roughly 54 percent of all electricity sales.
State of Energy Markets Across the U.S.
National – Electric & Natural Gas
The Federal Energy Regulatory Commission (FERC) issued its State of the Markets Report for 2024 (State of the Markets Report | 2024 | Federal Energy Regulatory Commission). The report provides an overview of U.S. Energy Markets and developments that occurred during the year. The FERC noted the following: (1) 2024 brought lower natural gas and wholesale electricity prices; (2) there was a marginal increase in natural gas demand, higher electricity demand, and lower net generation; (3) there were more electric generation capacity additions than retirements, however resource types differ as most capacity additions came from solar and battery storage that have a lower capacity factor, while retirements came primarily from coal and natural gas capacity that have a higher capacity factor; and (4) there were higher natural gas storage levels, higher natural gas capacity additions, and more transmission line miles completed.
Disclaimer of Liability
Every effort is made to provide accurate and complete information in Sprague’s Regulatory Matters. However, Sprague cannot guarantee that there will be no errors. Sprague makes no claims, promises, or guarantees about the accuracy, completeness, or adequacy of the contents and expressly disclaims liability for errors and omissions in the contents of this update.
Neither Sprague nor its employees make any warranty, expressed or implied or statutory, including but not limited to the warranties of noninfringement of third-party rights, title, and the warranties of merchantability and fitness for a particular purpose with respect to content available from Regulatory Matters. Neither does Sprague assume any legal liability for any direct, indirect or any other loss or damage of any kind for the accuracy, completeness, or usefulness of any information, product, or process disclosed herein, and does not represent that use of such information, product, or process would not infringe on privately owned rights.
The materials presented in Regulatory Matters may not reflect the most current regulatory or legal developments, verdicts, or settlements, etc. The content may be changed, improved, or revised without notice.
Copyright Statement
All content within Sprague Regulatory Matters is the property of Sprague unless otherwise stated. All rights reserved. No part of Regulatory Matters may be reproduced, transmitted, or copied in any form or by any means without the prior written consent of Sprague.


